

You’ve added your Planning Center events, groups, or sermons to your church website using PCO Embed. But how do you know if anyone is actually looking at them? Which embed gets the most attention? Is your groups finder being used, or is it sitting unnoticed at the bottom of a page nobody visits?
PCO Embed now includes a built-in statistics dashboard that answers exactly these questions — a live, interactive chart showing you how many times each of your embeds has been viewed, going all the way back to when you first set them up.
What the statistics dashboard shows
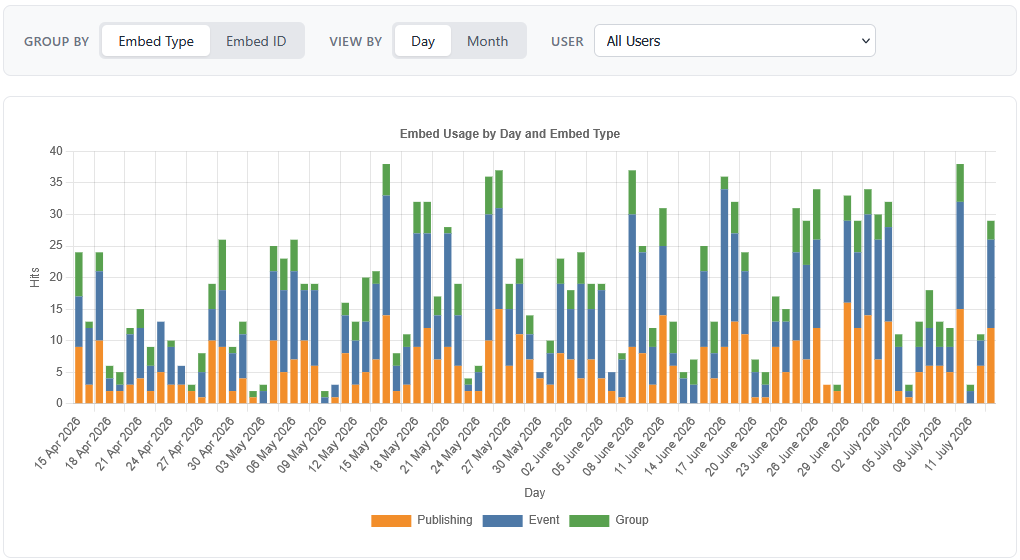
Inside your PCO Embed dashboard, the Embed Statistics page displays a stacked bar chart of every impression recorded across all your embeds. An impression is counted each time one of your embeds loads on your website — in other words, each time a visitor sees it.
The chart colour-codes your three embed types so you can see at a glance how your content is performing:
- Orange — Publishing (sermons)
- Blue — Events (calendar)
- Green — Groups
This means on a typical week you might see a tall blue bar on Sunday evening as people check upcoming events, steady orange bars mid-week as people catch up on the sermon, and green bars picking up at the start of a new term when people are looking to join a group.
Flexible grouping and time views
The statistics dashboard gives you two ways to slice the data, so you can zoom in on what matters.
Group by Embed Type or Embed ID
By default the chart groups impressions by embed type — Publishing, Event, and Group — giving you a high-level view of which category of content is getting the most traffic. If you have multiple embeds of the same type (for example, two separate events embeds on different pages), you can switch to Group by Embed ID to see each individual embed broken out separately. Hovering over any bar in Embed ID view shows you the embed’s type and configuration details so you always know which embed is which.
View by Day or Month
Switch between a daily view — which shows you granular day-by-day traffic patterns — and a monthly view that smooths things out for a longer-term picture. The daily view is great for spotting spikes around specific events or sermon series launches. The monthly view is better for tracking growth trends over time.
Your data goes back forever
Unlike many analytics tools that only retain 30 or 90 days of history, PCO Embed stores your impression data indefinitely. That means you can look back across months or years of usage to see how your website engagement has grown as your embeds have matured and your church has grown.
What you can learn from your embed statistics
A few things worth looking for when you explore your data:
Which content type drives the most traffic? If your sermon embed is getting three times the impressions of your events calendar, that tells you your congregation is using your website primarily to catch up on messages — which might influence where you place embeds on your homepage or how prominently you feature the sermons page in your navigation.
Are there weekly patterns? Most churches see clear weekly rhythms in their embed traffic — a spike in event views before the weekend, a spike in sermon views in the days after. Spotting these patterns tells you when people are most actively engaging with your website content.
Did a campaign work? If you promoted a new sermon series, sent out an email pointing people to your groups page, or ran a social media push, your embed statistics will show you whether it drove a measurable spike in traffic to those pages.
Is an embed being seen at all? Sometimes an embed gets placed on a page that turns out to have very low traffic. The statistics dashboard will surface this quickly — if an embed is showing near-zero impressions week after week, it might be worth moving it somewhere more prominent.
How to access your statistics
Log in to your PCO Embed dashboard at pcoembed.com and navigate to the Embed Statistics page. The chart loads automatically showing your full history grouped by embed type and viewed by day. Use the Group By and View By controls at the top to switch between views, and hover over any bar for a detailed breakdown of that day or month’s impressions.
No setup is required — PCO Embed has been recording impression data for your embeds automatically since the day you installed them.
Understanding how your website content is being used is the first step to making it work harder for your church. If you haven’t explored your embed statistics yet, log in and take a look — you might be surprised by what you find.